Why Retail Analytics Matters More This Black Friday
Shoppers are spending, but carefully. Adobe forecasts a record $275.1 billion in online holiday sales across the United States for 2026, up 6.7%, and expects Black Friday online sales of $12.9 billion, up 9.2%. Overall growth across the retail industry is softer, though. eMarketer and Salesforce expect holiday retail sales to rise 4.1%, with gas prices, inflation and tariffs weighing on budgets.
That mix rewards precision, and retail data insight is what delivers it, because it lets you make informed decisions instead of guesses. Volume alone will not protect profit if discounts run too deep or the wrong items sell out. Industry analysts also describe Black Friday as a multiday run of deals, not a single day.
What retail analytics covers
Retail analytics uses sales, inventory, pricing and customer data to guide decisions. It works in four layers: descriptive (what happened), diagnostic (why), predictive (what comes next) and prescriptive (what to do). Retail business intelligence tools usually cover the first layer through dashboards and standard reports. Retail analytics adds the “why” and the forecast, and good data analysis turns both into clear next steps for your team.
 Build Your Foundation: Clean Data and Forecast Demand
Retail analytics and retail business intelligence dashboards are only as good as their inputs, so start with the basics.
Fix your retail data first
Audit four things before you model anything:
- Tracking tags and checkout events fire on mobile and desktop
- SKUs, bundles and variants map to one product ID
- Returns and cancellations link to the original sale
- Store, web and marketplace sales data sit in one table
If your team is stretched, data processing and cleaning support can handle this work while analysts focus on forecasts.
Expert tip: Re-run last year’s sales through your cleaned data. If totals do not match finance’s numbers, fix that before forecasting.
Demand forecasting with retail analytics
Start with historical data from your last two or three Black Friday weekends, by SKU and by day. Compare years by days from Black Friday (for example, “Black Friday minus 3”), not by calendar date, because the holiday moves between years. Then adjust for 2026: new products, price changes, ad budgets and early deals. Adobe expects a Black Friday-sized burst of spending in October 2026, so compare this October with last year’s before you assume a late spike.
For new SKUs with no history, borrow the sales curve of a similar item. Forecast a range (low, expected, high) instead of one number, and tie reorder triggers to the range. Teams without data scientists can use big data analytics outsourcing services to build predictive models and routine reports.
Rank SKUs by their share of revenue or margin. “A” items are the top performers that drive most of your profit, “B” items are the middle tier, and “C” items are the long tail. Protect stock and margin on A items, use B items for bundles and secondary offers, and use C items to clear slow stock. This keeps your headline deals from coming out of your best sellers.

Set a price floor for every SKU
Calculate margin per SKU after discount, shipping, payment fees and expected returns. Then set a minimum price. Your retail data insight on price sensitivity should guide the cuts: elastic items earn deeper discounts, while items that sell anyway rarely need them.
Bundle slow movers with fast sellers instead of discounting everything. Tie offers to stock, too. If a doorbuster has hours of inventory left, retire the offer before you oversell.
Keep pricing claims honest. If you advertise “was/now” prices or “lowest price ever,” make sure the reference price and the claim meet the rules in your market.
Segment shoppers, including AI-referred visitors
Split customers into new, returning and high-value groups using retail data insight from past orders. It matters because Bluecore found that 64% of digital Black Friday shoppers across 150 brands in 2024 were new to the retailer. New buyers need a reason to come back, so plan follow-up offers now.
Add one more segment: AI-referred traffic. Adobe projects AI traffic to US retail sites to rise 130% this season, including 95% growth on Black Friday. Last year, Adobe data showed AI-referred shoppers converting 38% better on Black Friday. AI referrals often show up as direct traffic, so tag visits from ChatGPT, Perplexity and Gemini (for example, by referrer or UTM rules in GA4) so you can see their conversion and order value. For more trends like this, see these data analytics innovations for e-commerce.
If you have physical stores, add a store-pickup segment too. Local shoppers who buy online and collect in store behave differently from delivery shoppers, and they often add items at pickup.
Good retail analytics compares channels by conversion and margin, not traffic. RetailNext measured in-store traffic down 3.6% on Black Friday 2025. Mastercard SpendingPulse reported total Black Friday sales, across all channels, up 4.1%. These figures are not like-for-like, so pair in-store traffic with in-store sales when you analyze your own stores. Footfall is a weak stand-in for sales.
Mobile needs equal attention. Adobe projects mobile at 57.4% of online holiday sales, so test mobile checkout before the event.
For fraud, watch order velocity, mismatched billing and shipping details, and sudden spikes in one payment method. For returns, track rates by SKU. Deep discounts attract returns that erase margin, but returns lag the sale. In the first weekend, watch early signals such as bracketing (the same item in several sizes), fit complaints and damage contacts. Check actual return rates by SKU again in January.
Measure marketing efficiency, not just ad spend
Ad spend against revenue by campaign (ROAS) can look strong on Black Friday while blended efficiency slips. Track marketing efficiency ratio (MER): total revenue divided by total marketing spend. Add new-customer acquisition cost if you can. Black Friday is often the best revenue day but the worst MER day, so decide in advance what MER you will accept.
Choosing how to run your Black Friday analytics comes down to three options: manual spreadsheets, a dedicated retail analytics platform, or outsourced analytics support. Each trades off speed, live monitoring, cost and the skills your team needs. The table below compares them side by side so you can match the option to your catalog size, budget and holiday shopping season workload.
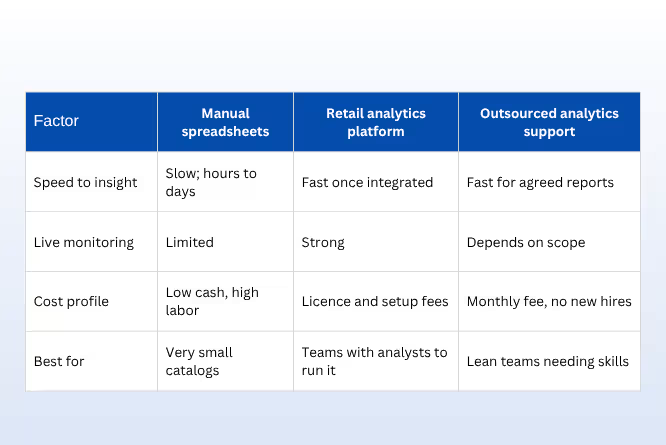
Common tools at each level include your store platform’s built-in reports, GA4 with Looker Studio for free dashboards, and BI suites such as Power BI or Tableau for larger teams. Pick what your team can actually maintain.
A retail analytics platform or retail business intelligence suite suits teams that already have analysts to configure and read it. If you are weighing build against buy, this comparison of in-house vs outsourced data analytics services covers the trade-offs.
Your Retail Analytics Timeline for Black Friday 2026
Use this retail analytics schedule for the final two weeks before the sale. For extra peak-season capacity, these outsourcing strategies for eCommerce teams show what to hand off.
- Nov 13–15, audit: Clean data, test tags, pull three years of Black Friday sales.
- Nov 16–19, forecast: Build SKU forecasts with ranges. Set reorder triggers.
- Nov 20–23, plan: Lock price floors, the offer calendar, segments and staffing.
- Nov 24–25, dry run: Build the dashboard, set alerts, run a mock hour.
- Nov 26–27, Thanksgiving and Black Friday: Monitor hourly and adjust.
- Nov 28–30, weekend and Cyber Monday: Rebalance stock and ad spend for Monday.
- Dec 1–3, review: Run the post-event analysis.
Run a live dashboard on the day
A good retail business intelligence dashboard answers one question: what must we change in the next hour? Build it with real-time data analytics practices so numbers refresh fast. Track these six KPIs:
- Conversion rate by device and channel
- Stock left on your top 20 SKUs
- Margin per order after discount
- Checkout errors and page speed
- Fraud flags and early return signals
- Marketing efficiency (MER) and ad spend against revenue by campaign
Give each KPI an alert threshold and a named owner.
Expert tip: Run a mock hour on November 25. A dry run exposes slow refreshes and unowned alerts before real traffic does.
Staffing and in-store KPIs
If you run physical stores, add an hourly board for the shop floor:
- Traffic against transactions by hour (store conversion)
- Queue wait time at checkout
- Sales per labor hour
- Pickup orders waiting, if you offer click-and-collect
Use last year’s hourly traffic to schedule staff, and add cover where traffic peaks and queues form. Review the board hourly so you can move people to the tills or the pickup desk as it changes.
Post-event analysis: turn results into retail data insight
Within 72 hours, compare actuals with forecast by SKU. Note which promotions lifted profit, not just revenue, which segments returned, and which stockouts cost sales. Feed these results into your retail analytics models so next year’s forecast starts with better inputs. Re-check returns in January.
Common mistakes to avoid
- Forecasting from a single year of data
- Judging promotions by revenue instead of margin
- Treating store traffic as sales
- Building dashboards nobody owns
- Skipping the dry run
Make Retail Analytics Your Black Friday Advantage
Retail analytics rewards retailers who decide with evidence. Clean your retail data, forecast by SKU, protect margin and watch the day live. Then use the results to start next year’s plan early.
Need a partner? BolsterBiz offers analytics support for e-commerce and retail businesses.
Book a 30-minute call to talk through your forecasts, dashboards and next steps.
Frequently Asked Questions
1. What is retail analytics and how does it help on Black Friday?
Retail analytics uses sales, inventory, pricing and customer data to guide decisions. For Black Friday, it forecasts demand by product, sets margin-safe discounts, flags stock risks early and shows live performance, so retailers avoid stockouts, overstock and unprofitable promotions.
2. When should retailers start preparing for Black Friday with analytics?
Ideally two to three months ahead, which leaves room for data cleanup, forecasting and supplier orders. If you are starting late, focus on three things: clean data, forecasts for your top SKUs and a live dashboard for the day.
3. Which retail analytics metrics matter most on Black Friday?
Watch conversion rate by device, remaining stock on top SKUs, margin per order after discounts, checkout errors, fraud flags and return signals. Revenue alone hides problems, so pair it with margin and inventory metrics reviewed every hour during the event.
Not always. Small retailers can start with clean spreadsheets and their store platform’s reports. A retail analytics platform pays off once you sell across several channels or SKUs. Outsourced analytics support is a middle option when you lack in-house analysts.
5. What is the difference between retail business intelligence and retail analytics?
Business intelligence mostly reports what happened through dashboards and standard reports. Retail analytics goes further, explaining why it happened, forecasting what comes next and recommending what to do.
6. How do you forecast Black Friday demand by SKU?
Use two to three years of Black Friday sales by SKU and by day, aligned by days from Black Friday rather than calendar date. Adjust for new products, price changes and ad budgets, then forecast a low, expected and high range. For new SKUs, borrow the curve of a similar item.
-
This article is written by Sudhir Tomar. He is a content writer at BolsterBiz, covering niches like outsourcing, customer support, digital marketing, and more. He crafts content that informs, ranks, and connects with the right audience. Outside of work, Sudhir is passionate about sports, travel, and adding the perfect flavors to dishes. For any related queries reach at sudhir.tomar@bolsterbiz.com