

Leading vs. Lagging Customer Satisfaction Metrics
Most guides to customer satisfaction metrics list KPIs in no particular order. That misses the most useful way to think about them: some metrics predict satisfaction before it fully shows up, others confirm it after the fact.
Leading indicators like CSAT, CES, and sentiment analysis are captured close to the moment of interaction. They tell you something is going wrong (or right) while there’s still time to act. Lagging indicators like churn rate, retention rate, and NPS trends over time confirm the cumulative effect of everything that happened before. They’re accurate, but by the time churn spikes, the damage is already done.
The stakes for getting this right are real. According to Zendesk’s 2026 CX Trends report, 70% of consumers are ready to drop a brand after just two bad interactions. Tracking leading indicators gives you the chance to fix a problem before it becomes a lagging statistic.
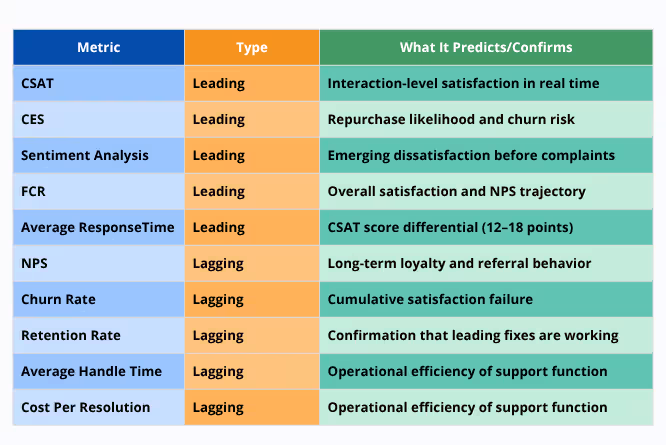
10 Customer Satisfaction KPIs to Track
Here’s the full SEO checklist for local small business websites, broken into three tiers: what to do first, what to do next, and what needs ongoing attention. Skipping the order is the most common mistake we see; businesses jump straight to schema markup while their Google Business Profile is still half-finished.
1. Customer Satisfaction Score (CSAT) — Leading Indicator
CSAT measures satisfaction with a specific interaction, typically on a 1-5 scale expressed as a percentage. Formula: (Number of satisfied responses ÷ total responses) × 100. It’s the most direct of all customer service KPIs, captured right after a support ticket, purchase, or service call while the experience is still fresh.
2. Net Promoter Score (NPS) — Lagging Indicator
NPS measures overall loyalty by asking one question: how likely are customers to recommend you, on a 0-10 scale. Formula: % Promoters (9-10) minus % Detractors (0-6). Unlike CSAT, NPS reflects the relationship over time and is typically tracked quarterly rather than after every interaction. Repurchase intent, a behavioral measure of how likely a customer is to buy again, is a closely related lagging indicator: it reflects the same cumulative relationship health as NPS, but measures actual buying behavior rather than stated loyalty.
3. Customer Effort Score (CES) — Leading Indicator
CES measures how easy it was for a customer to get their issue resolved, usually on a 1-7 scale, where 1 = very difficult and 7 = very easy. Formula: Sum of all effort scores ÷ number of respondents. A score above 5.0 is generally considered strong. Note: some vendors invert this scale, so always check your platform’s configuration before comparing scores across tools. Low-effort experiences correlate strongly with repeat purchases, making CES one of the more predictive customer satisfaction metrics available.
4. First Contact Resolution Rate (FCR) — Leading Indicator
FCR tracks the percentage of issues resolved in a single interaction, with no follow-up required. Formula: (Issues resolved on first contact ÷ total issues) × 100. FCR is one of the strongest predictors of both CSAT and NPS, since customers strongly dislike repeating themselves across multiple contacts.
5. Average Response Time — Leading Indicator
This tracks how quickly your team responds to a customer’s initial inquiry, across email, chat, or phone. According to HubSpot Service Benchmarks, responses within one hour score 12 to 18 points higher on CSAT than responses taking 24 hours or more, making speed one of the most controllable customer service KPI levers available to any support team.
6. Customer Churn Rate — Lagging Indicator
Churn measures how many customers stop using your product or service in a given period. Formula: (Customers lost during period ÷ customers at start of period) × 100. No matter how satisfied customers are, some will always leave, but tracking who and why gives you the intelligence to reduce it.
7. Customer Retention Rate — Lagging Indicator
Retention is the inverse lens on churn, measuring how many customers you keep over a given period. Formula: ((Customers at end − new customers acquired) ÷ customers at start) × 100. Rising retention alongside strong customer satisfaction metrics confirms your leading indicators are translating into real business outcomes.
8. Average Handle Time (AHT) — Lagging Indicator
AHT measures the average duration of a single support interaction, including talk time, hold time, and wrap-up work. Formula: (Total talk time + hold time + wrap-up time) ÷ number of interactions. It’s one of the most operationally actionable metrics available to a support team, trending AHT alongside CSAT shows whether interactions are getting faster without sacrificing quality, or faster at quality’s expense.
9. Sentiment Analysis Score — Leading Indicator
Sentiment analysis scans support tickets, reviews, and social mentions for emotional tone, surfacing dissatisfaction before a customer files a formal complaint or leaves a low survey score. It’s increasingly automated through AI tools, making it one of the fastest-growing customer service KPIs in 2026.
10. Cost Per Resolution — Lagging Indicator
Cost per resolution measures how efficiently your team resolves issues in dollar terms. Formula: Total support cost ÷ number of tickets resolved. It’s one of the AI-era metrics most teams still overlook, but it’s now standard in the strongest 2026 guides because it ties support quality directly to unit economics, a low cost per resolution paired with strong CSAT signals a genuinely efficient support operation, not just a cheap one. BolsterBiz’s outsourcing cost calculator walk through how to benchmark this against an in-house team.

Conclusion
Strong customer satisfaction metrics programs track both leading indicators, CSAT, CES, sentiment, and response time, and lagging indicators, churn, retention, and NPS trends, rather than fixating on a single score. Leading indicators tell you what to fix now. Lagging indicators confirm whether those fixes actually worked.
The strongest customer service KPIs framework isn’t the one with the most metrics, it’s the one matched to your business model and reviewed often enough to act on. Getting this mix right is what separates teams that catch problems early from those that only find out after a customer has already left.
Ready to build a measurement system that actually drives action? Talk to BolsterBiz about your customer experience strategy today.
Divide your total support cost for a given period by the number of tickets resolved in that same period. The formula is: Total support cost ÷ number of tickets resolved. Tracking this alongside CSAT shows whether your support operation is improving efficiency without sacrificing quality.


